Architecuture
Overview
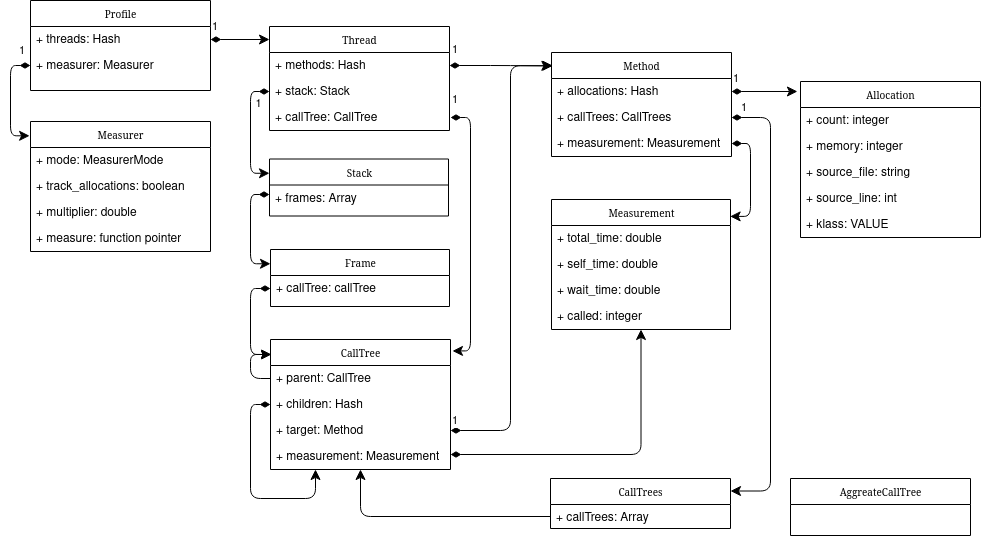
ruby-prof is a profiler for MRI Ruby. Its built as a C extension and therefore many times faster than the standard Ruby profiler. The image below shows the main classes that make up ruby-prof:

profile = RubyProf.profile do
            ..
          end
A profile owns a hash of threads, and threads in turn own the methods called in that thread as well as call trees which record how the methods were called.
Memory Management
The master object is the Profile object. Each Profile object is responsible for managing the memory of its child objects which are C structures. When the Profile object goes out of scope, it recursively frees all its objects. In the class diagram, this can bee seen via the composition relationships. The owning object is denoted with a filled in black diamond. Thus a Profile frees its threads, Threads free their CallTrees and Methods, etc.
You should always keep a reference to a Profile object so that you can generate profiling reports. However, RubyProf will keep a Profile object alive, even if it has no direct references, as long as there are live references to either a MethodInfo object or a CallTree object. This is done via the GC mark phase. CallTree instances mark their associated MethodInfo instances, and MethodInfo instances in turn mark their owning Profile instance.
Starting with version 1.5 it is possible to create new instances of the Thread, CallTree and MethodInfo classes from Ruby. In general you won't need to use this functionality - it was added to make it easier to write tests. However, this functionality does complicate memory management because some objects are now owned by the C extension while others are owned by Ruby. To track this information an internal ownership flag was added to instances of these classes. RubyProf automatically handles this, but it is important to understand if you are reading or modifying the C code.
