Reports
Once you have completed a profiling run, you will want to generate a report to analyze the results. One of ruby-prof's strengths is the number of ways it lets you visualize profiling results, from quick text summaries to interactive HTML views and external tooling formats. The following table shows all supported report types and when to use them:
For repeatable profiling workflow guidance, see Best Practices.
| Name | Best For |
|---|---|
FlatPrinter |
Finding hottest methods fast (best quick signal by self time) |
GraphPrinter |
Understanding who called a hot method (caller/callee context in text) |
GraphHtmlPrinter |
Exploring large call graphs interactively (clickable navigation) |
FlameGraphPrinter |
Seeing hot paths visually (where time accumulates) |
CallStackPrinter |
Inspecting execution-path dominance (tree of major runtime paths) |
CallTreePrinter |
Using external profiler tooling (KCachegrind/callgrind format) |
CallInfoPrinter |
Debugging ruby-prof internals/data shape (low-level call-tree details) |
MultiPrinter |
Generating several outputs at once (one run, multiple files) |
Recommended workflow:
- Run
FlatPrinterto find top offenders. - Use
GraphHtmlPrinter(orGraphPrinter) to understand caller/callee relationships. - Use
FlameGraphPrinterto visually validate dominant paths.
Creating Reports
Reports are created via the use of printers:
profile = RubyProf::Profile.profile do
            ...
          end
printer = RubyProf::GraphPrinter.new(profile)
printer.print(STDOUT, min_percent: 2)
The first parameter is any writable IO object such as STDOUT or a file. All printers accept the following keyword arguments:
| Option | Default | Description |
|---|---|---|
min_percent |
0 |
Minimum %self time for a method to be included (0–100). |
max_percent |
100 |
Maximum %self time for a method to be included (0–100). |
filter_by |
:self_time |
Which time metric to use when applying min_percent and max_percent. |
sort_method |
varies | How to sort methods. Values: :total_time, :self_time, :wait_time, :children_time. |
max_depth |
nil |
Maximum call tree depth to display. When set, printers that walk the call tree stop descending beyond this depth. Applies to FlameGraphPrinter, CallStackPrinter, and CallInfoPrinter. |
Report Types
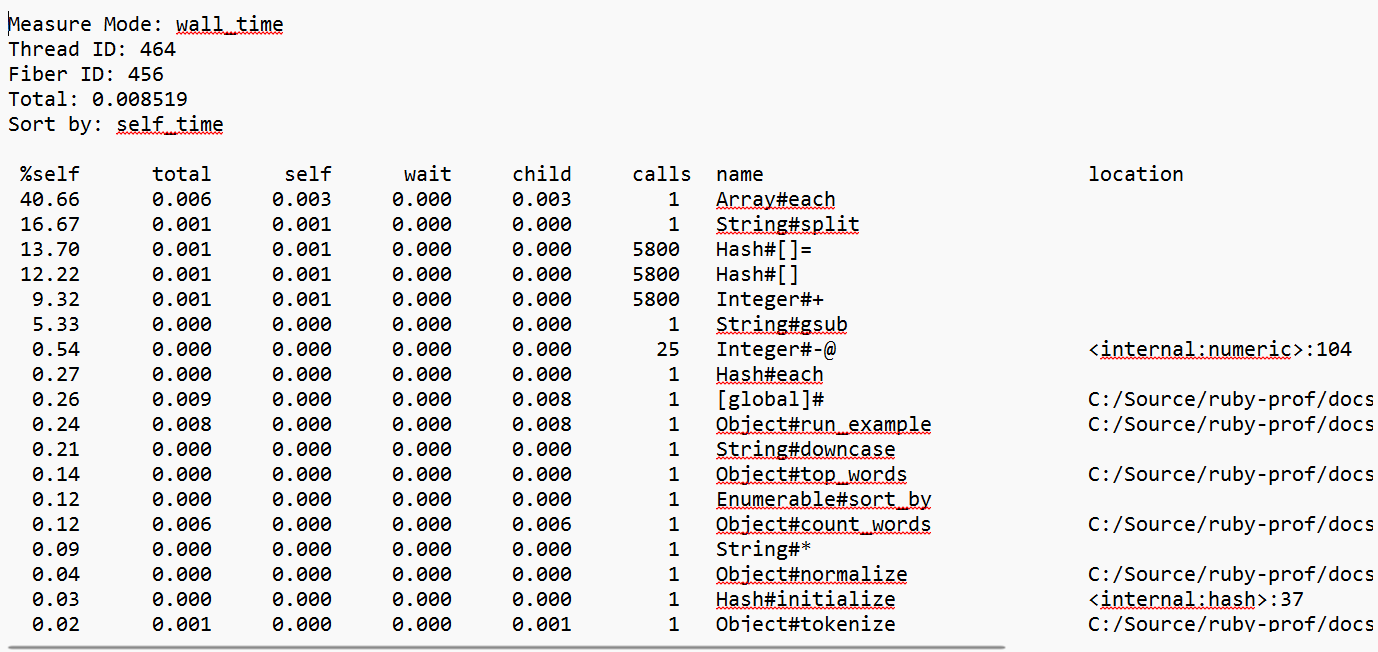
Flat
The flat report shows the overall time spent in each method. It is a good way of quickly identifying which methods take the most time. Use RubyProf::FlatPrinter to generate this report. Default sort_method is :self_time. (example)
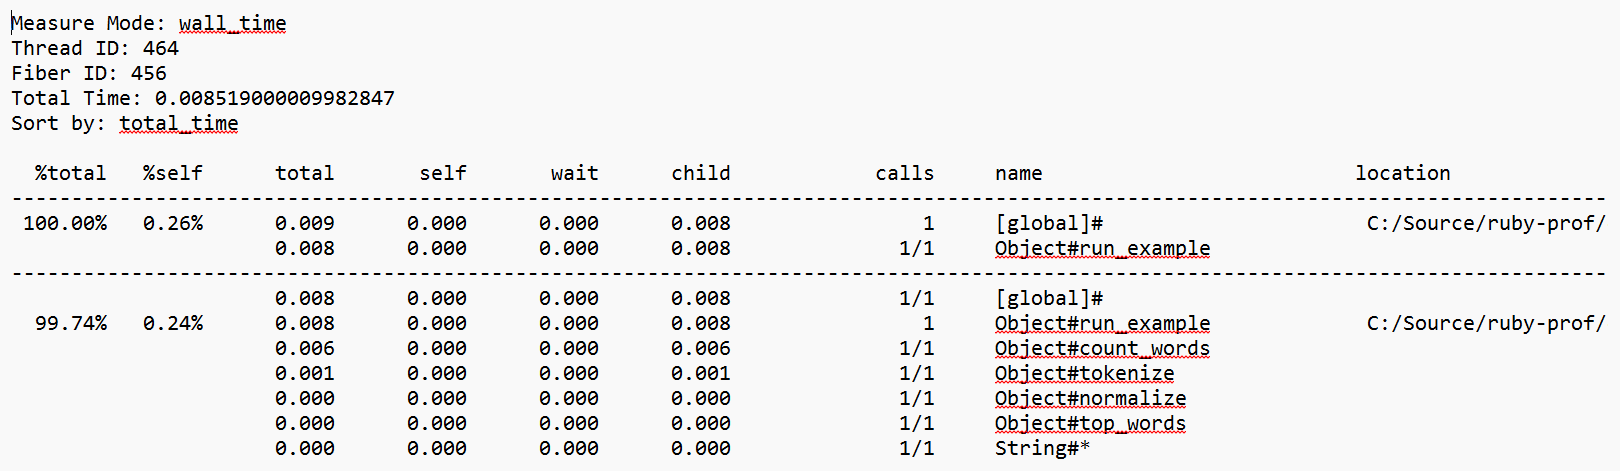
Graph (Text)
The graph report shows the overall time spent in each method. In addition, it also shows which methods call the current method and which methods it calls. Thus they are good for understanding how methods get called and provide insight into the flow of your program. Use RubyProf::GraphPrinter to generate this report. Default sort_method is :total_time. (example)
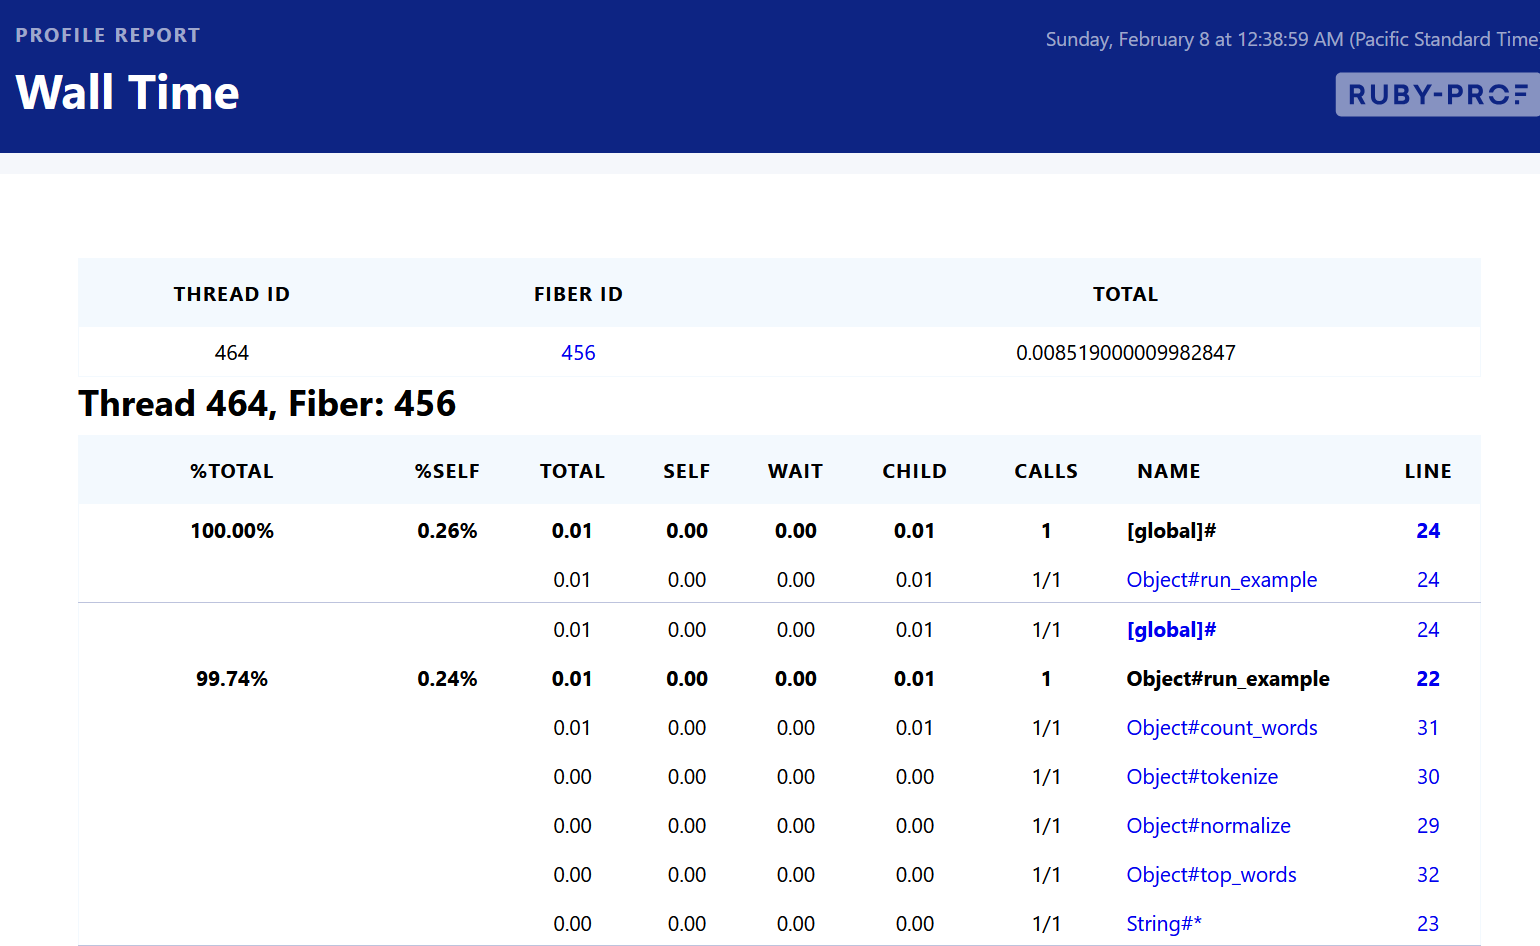
Graph (HTML)
HTML Graph profiles are the same as graph reports, except output is generated in hyper-linked HTML. Since graph reports can be quite large, the embedded links make it much easier to navigate the results. Use RubyProf::GraphHtmlPrinter to generate this report. Default sort_method is :total_time. (example)
Additional options:
| Option | Default | Description |
|---|---|---|
min_time |
nil |
Minimum total time (in seconds) for a method to be shown. |
nonzero |
false |
When true, sets min_time to 0.005 if min_time is not specified. |
Flame Graph
Flame graph reports produce a self-contained HTML visualization of the profiled code. Each method is represented as a horizontal bar whose width is proportional to its total time. Bars are stacked vertically by call depth, making it easy to identify hot code paths at a glance. A toggle switches between flame (bottom-up) and icicle (top-down) views. Use RubyProf::FlameGraphPrinter to generate this report. (example)
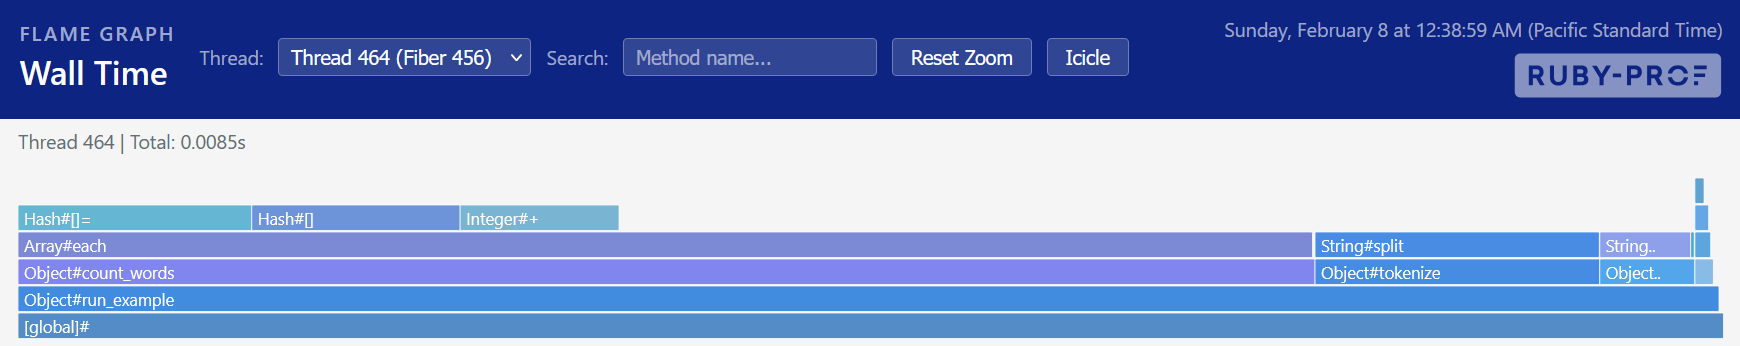
Interactive features include hover tooltips (showing method name, self time, total time, percentage, and call count), click-to-zoom into a subtree, a reset zoom button, a search box to highlight matching methods, and a thread selector when multiple threads are profiled.
Additional options:
| Option | Default | Description |
|---|---|---|
title |
"ruby-prof flame graph" |
Title displayed in the HTML report. |
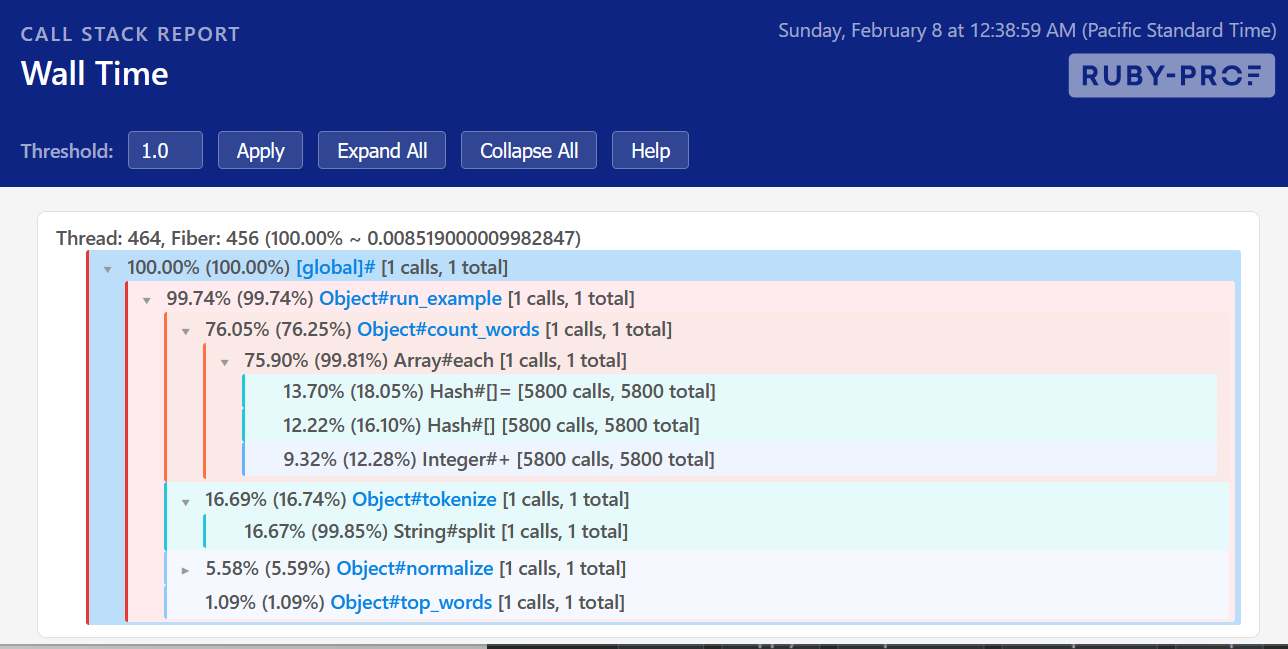
Call Stack
Call stack reports produce an HTML visualization of the time spent in each execution path of the profiled code. Use RubyProf::CallStackPrinter to generate this report. (example)
Additional options:
| Option | Default | Description |
|---|---|---|
title |
"ruby-prof call stack" |
Title displayed in the HTML report. |
threshold |
1.0 |
Minimum %total for a node to be visible (0–100). |
expansion |
10.0 |
Minimum %total for a node to be expanded by default (0–100). |
application |
$PROGRAM_NAME |
Application name displayed in the report. |
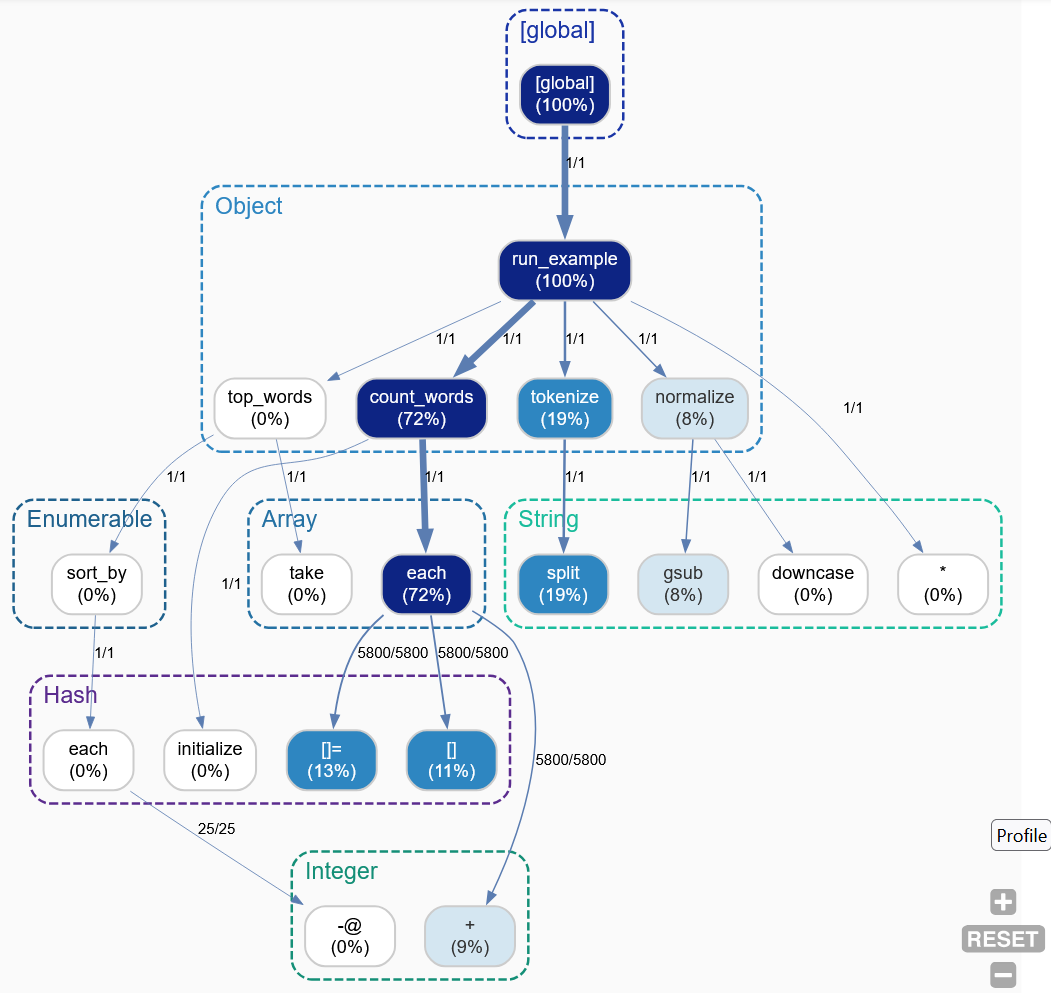
Graphviz
The graphviz report is designed to be opened by Graphviz to create visualization of profile results. The output can be visualized using the Graphviz Online viewer. Use RubyProf::DotPrinter to generate this report. (example, view online)
Cachegrind
Cachegrind output results in the calltree profile format which is used by KCachegrind. More information about the format can be found at the KCachegrind site. Use RubyProf::CallTreePrinter to generate this report. (example)
Additional options:
| Option | Default | Description |
|---|---|---|
path |
"." |
Directory where callgrind output files are written. |
Call Info Report
Call info reports print the call tree with timing information for each node. This is mainly useful for debugging purposes as it provides access into ruby-prof's internals. Use RubyProf::CallInfoPrinter to generate this report. (example)
Multiple Reports
RubyProf::MultiPrinter can generate several reports in one profiling run. It requires a directory path and a profile basename for the files it produces:
| Option | Default | Description |
|---|---|---|
path |
"." |
Directory where report files are written. |
profile |
"profile" |
Base filename for the generated reports. |
All other keyword arguments are forwarded to the individual printers.
Generating Examples
To regenerate the example reports:
This profiles a small word-frequency workload and writes reports to docs/public/examples/reports/.