ruby-prof
ruby-prof is a tracing profiler for MRI Ruby with a long history that dates back to 2005! Its features include:
- Measurement Modes - ruby-prof can measure program wall time, process time and object allocations.
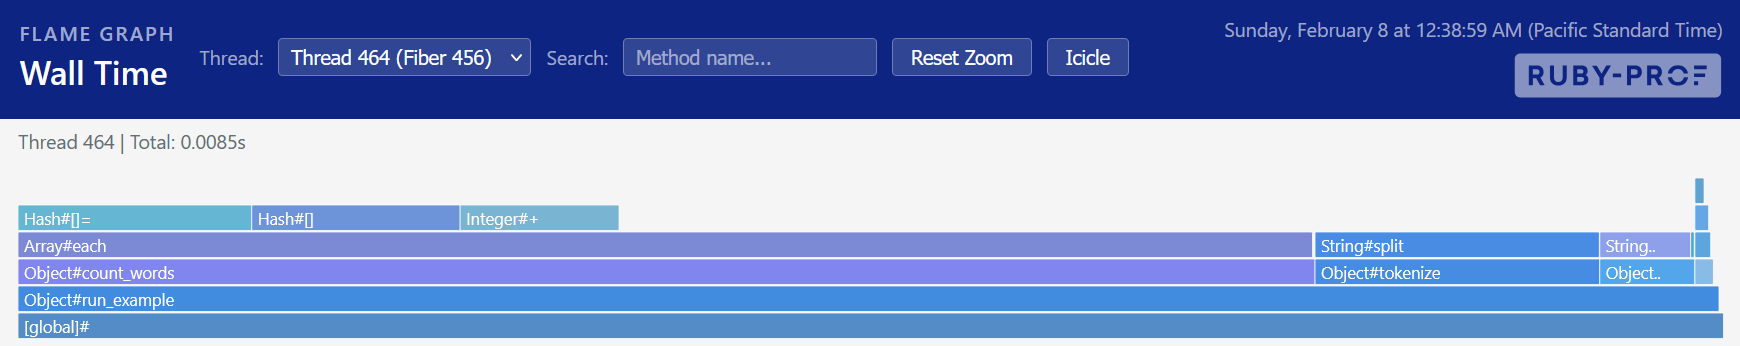
- Reports - ruby-prof can generate flat, graph (text), graph (HTML), flame graph, call stack, graphviz, cachegrind, and call info reports.
- Threads - supports profiling multiple threads simultaneously.
- Fibers - supports profiling multiple fibers simultaneously.
- Merging - supports merging results across fibers or threads
- Recursive - supports profiling recursive methods
Why ruby-prof?
ruby-prof is helpful if your program is slow and you want to know why! It can help you track down methods that are either slow or allocate a large number of objects. Often times the results will surprise you - when profiling what you think you know almost always turns out to be wrong.
Installation
To install ruby-prof:
If you are running Linux or Unix you'll need to have a C compiler installed so the extension can be built when it is installed. If you are running Windows, then you should install the Windows specific gem or install devkit.
ruby-prof requires Ruby 3.2.0 or higher. If you need to work with older Ruby versions then you can download an older version of ruby-prof.
Performance
ruby-prof is a tracing profiler, not a sampling profiler, and thus will cause your program to run slower. Our tests show that the overhead varies considerably based on the code being profiled. Significant effort has been put into reducing this overhead, but most programs will run approximately twice as slow while highly recursive programs (like the fibonacci series test) may run up to five times slower.
History
ruby-prof has been under continuous development since 2005 — see the full History page.
API Documentation
API documentation for each class is available at the ruby-prof API docs.
License
See LICENSE for license information.
Development
Code is located at github.com/ruby-prof/ruby-prof.